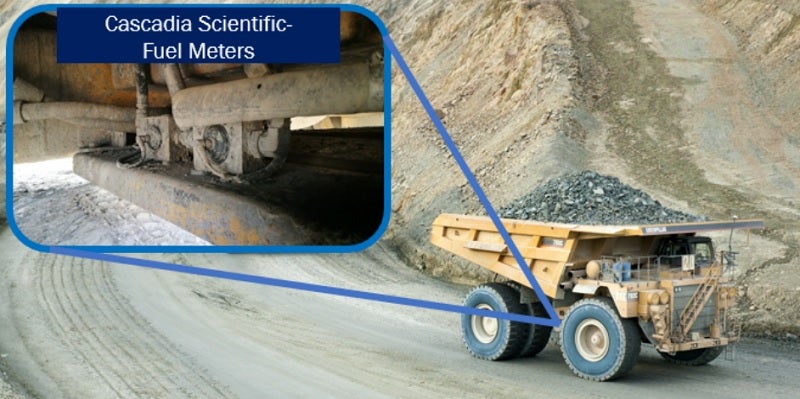
Cascadia Scientific Launches Mine Road Fuel Intensity Heat Mapping
Diesel fuel can constitute as much as 30% of a mine’s operating costs. Moreover, the largest single contributor to energy consumption in an open-pit mining operation is haul trucks. Therefore, it is no surprise that the economic and environmental costs related to equipment fuel consumption are a significant interest in the mining industry.
The challenge: Immediately identify haul segments with highest fuel intensity
Mine planners have long been aware of the relationship between road design and haulage efficiency. They are experts at setting ramp angle, corner radius and bench height to strike an ideal balance between construction costs, production levels and efficiency. But once these ramps, benches and haulage routes are built, how much attention is paid to the relationship between specific road segments and efficiency? In most cases, the simple answer is not enough.
In August 2019, a Cascadia Scientific SmartRView subscriber requested a map depicting their haulage roads overlaid with colours indicating the amount of fuel burned across each road segment. In fact, this was not a new question, we had been asked to perform similar tasks by several customers and prospects in the year leading up to this point and decided this use case demanded attention. We responded to this request, first by augmenting our data capture strategy by increasing the sampling frequency of key data elements. Then, with the data-pipeline in place, we began to develop the analytics and graphical representations of the data.
The results
The results were compelling. At the first mine where this technique was employed, 5 distinct fuel-intensity hotspots emerged immediately, appearing on the map with the characteristic crimson of a clogged freeway on your preferred traffic app. An investigation into these previously unidentified trouble spots was quick to uncover the underlying problem:
The worst segment of the mine had a fuel intensity of 0.056 litres/meter which was an astounding 84% higher than the ‘ideal’ sections of the ramp. In both cases, the equipment was operating at full engine load and consuming about the same fuel per unit of time, but in the case of the trouble spot, the truck was slowed to a crawl. Mine planners had targeted specific ramp angles across the mine, and the ideal segment of the ramp was right on target, with a measured ramp angle within 2.5% of targeted ramp angle. The hot spot, on the other hand, had an average measured ramp grade 44% higher than the targeted angle. The initial reaction to this finding was to assume that the steeper ramp grade meant that more useful work was being performed on account of the steeper angle of attack. When comparing this hot spot to the “ideal” road section, even with the increase ramp angle considered, the vertical speed on the ideal section was 26% faster than that observed the problem section, outlining a clear area for improvement. This information, along with precision coordinates was shared with the customer so that road maintenance could be prioritized.
Not Just Another Heat Map
When developing these tools, the first strategy considered was to leverage one of many available libraries with native heat map support. It soon became clear that every heat map tool we examined rendered colours as a function of intensity and density. Thus, a standard heat mapping approach would do very well to illustrate the roads that account for the most fuel burned overall, but would not normalize for haulage frequency. As an example, a very well constructed and maintained road segment that is heavily travelled would be rendered deep red, indicating a problem, when no real opportunity for improvement exists. To quickly draw attention to problematic road segments instead of well-travelled road segments, a rendering was required that would normalize for haulage frequency. With this discovery began the complex work of programming and fine-tuning the interaction between nearby samples and the gaussian blending into the red-blue (hot-cold) spectrum.
Upon review of the first heat maps produced by our earliest prototypes, which considered fuel intensity to be equivalent to the fuel consumption rate, the next challenge became clear. The map was rendered almost entirely in two colours: Yellow appeared everywhere that haul trucks were climbing a ramp with load, and a cool violet indicated areas of the mine where trucks travelled downhill or on generally flat ground. What this prototype failed to account for, was that during the most fuel-intensive periods of operation (loaded travel out of the pit) operators use full power, and thus fuel consumption rates are held at near-constant peak value. This value is a function of the engine design, and not the quality or construction of the roads. The areas of most interest were therefore, those characterized by maximum fuel combined with lowered speeds.
Once these custom heatmaps were redesigned to express fuel intensity in terms of fuel per distance, the full spectrum of colour and the characteristic signature of problem areas jumped off the page.
For the time being, all Cascadia Scientific SmartRView subscribers benefit from weekly fuel intensity heat maps produced offline by our team of data scientists.A fully automated version of the Fuel Intensity Heat Map feature will be built into in the SmartRView web portal later this year.