X10-Geo is a statistical data analytics and reporting platform built for the exploration and mining industry.
Used worldwide, the solution’s industry-leading geostatistical analysis tools were created for the exploratory data analysis (EDA) of drilling, block model and other geospatial data. It is used by geoscientists in exploration, resource estimation, geochemistry, geotechnical, metallurgy, mine planning and optimisation applications.
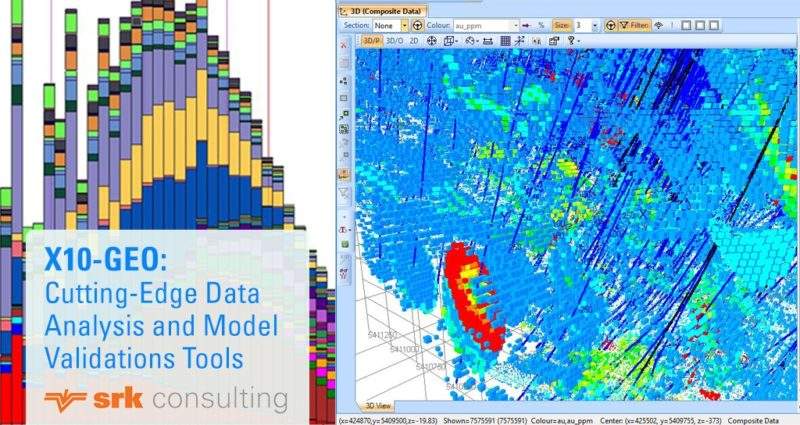
One of the main advantages of X10-Geo is that all the tools for analysing drill hole and block model data and 3D visualisation are contained in a single dynamic, integrated and easy-to-use package.
Time-saving 3D integrated software for geological data analytics and analysis
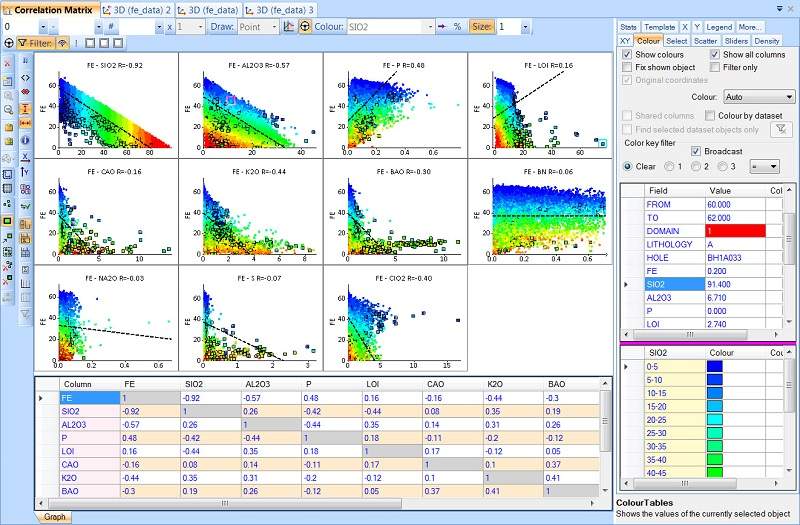
Combining raw data and statistical analytics in tables and summary graphs with interactive 3D visualisation, X10-Geo allows the geoscientist to quickly and easily identify outliers, trends and patterns in their geospatial data.
In addition to multiple domain and multi-element data analysis, the software easily compares data sets such as different block models used in resource estimation and mine planning, legacy data to the latest drill programme, and different drilling types and campaigns.
Along with the increased efficiency provided by X10 through minimising the time needed to analyse and automatically report the data, key benefits of X10-Geo include reduced costs, a better understanding of complex data sets, and a more streamlined geological data analysis workflow.
Advanced analysis of geological data reduces risk and uncertainty
X10-Geo allows a methodical and systematic approach to your data analysis that is both efficient and accurate, for example, to create a quick picture of the significant trends in the initial exploration data to refine drilling targets, conducting more detailed geoscientific data analytics further down the mine value chain, or while working with and comparing legacy data of variable quality.
By maximising insight into the data set, the solution can:
- Aid target interpretation
- Help to understand relationships between elements and domains
- Identify and remove outliers and anomalies
- Show the differences between various related data sets
- Find associated spatial trends
- Validate mineralisation domain and block models
The software ultimately prevents expensive rework and provides the information for making better-informed decisions. By understanding the inter-relationships within your data, particularly early in the mine value chain, you reduce the risk of making costly mistakes.
An extendable Exploratory Data Analysis platform
Exploratory data analysis is where the data itself is used to reveal the underlying structures and messages primarily by using graphical techniques. The graphical analysis in X10-Geo can gain a clear picture of the distribution of both the raw and derived data, which helps to identify relationships that may require further analysis.
X10-Geo can be extended to suit your way of working in three ways:
- Building your own powerful 3D integrated graphs
- Using the X10-Workflow extension to integrate your own and third-party tools and processes
- Creating customised X10-based apps for ultimate extendibility
Combining X10-Geo’s strong data analytics with your favourite tools gives you the best of both worlds and boosts your efficiency by integrating validation of analysis results in your existing workflows.
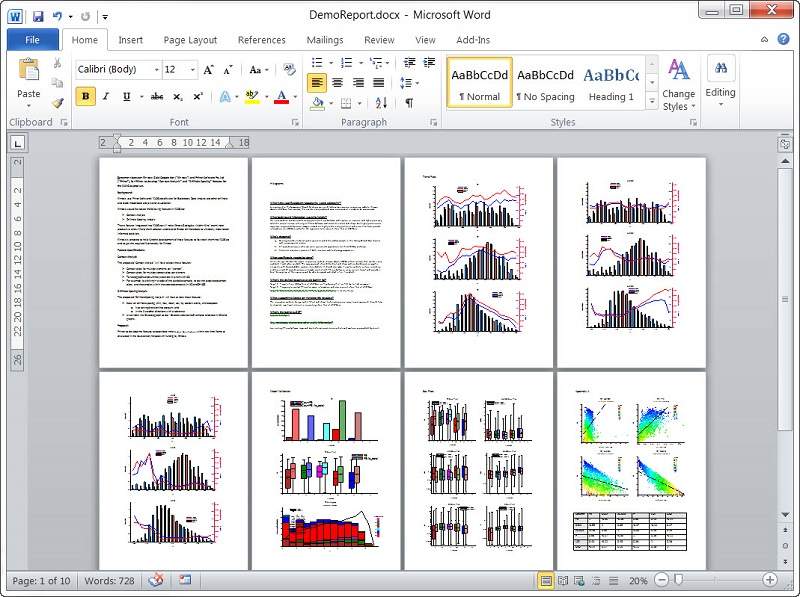
Automatic creation and reporting of useful graphs and statistics
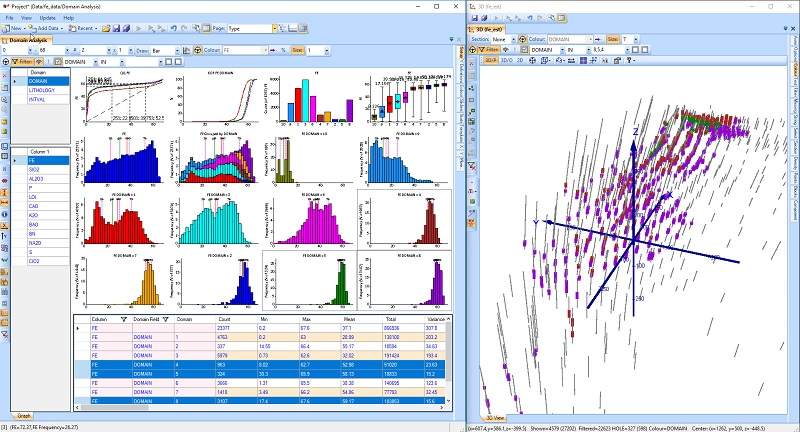
A range of techniques is available in X10-Geo where data can be presented automatically in graphical format. Graphs such as scatter plots, histograms, probability plots, quantile-quantile (QQ) plots, box plots and associated summary statistics are automatically generated and reported for multiple domains and elements.
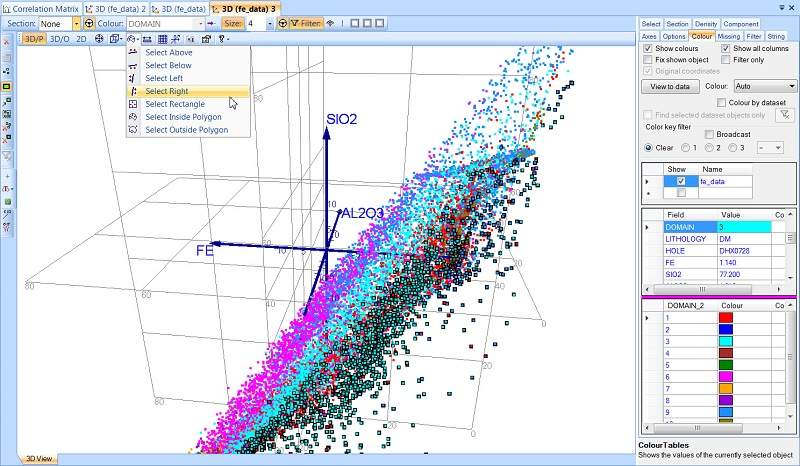
Filters can be easily applied to quickly find trends associated with conditions determined by other elements or domains. A fully integrated and dynamic 3D viewer gives immediate feedback on any associated spatial trends.
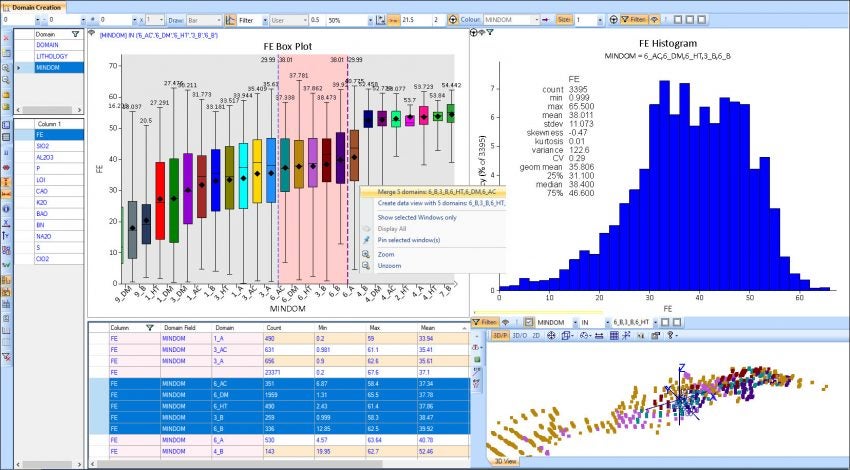
X10-Geo provides statistical, graphical and spatial analysis of geological and grade or mineralisation domains to determine if the data represents a single spatial and statistical population, and that the domain summary statistics are consistent by using histograms, box and log probability plots.
The solution also provides powerful tools such as stacked box and whisper plots for merging or splitting domains.
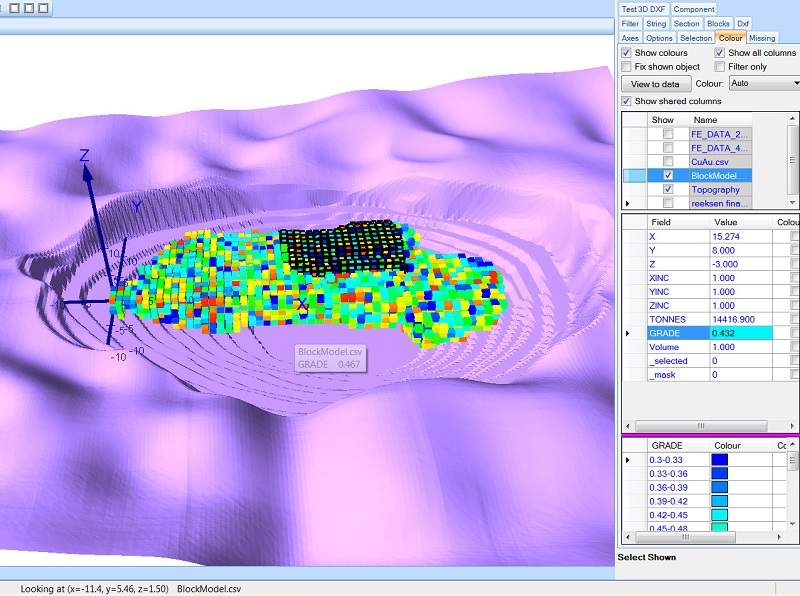
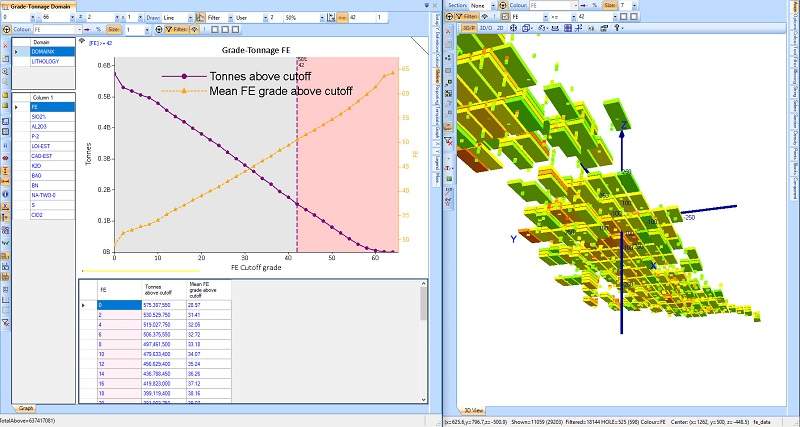
Model validation in X10-Geo is used to plot, compare and report estimated grades against actual grades with Trend, QQ and other graphs. Grade Tonnage Curves can be generated and reported (by domain) showing the amount of ore available and the associated blocks in 3D at certain cut-off grades intuitively with a slider.
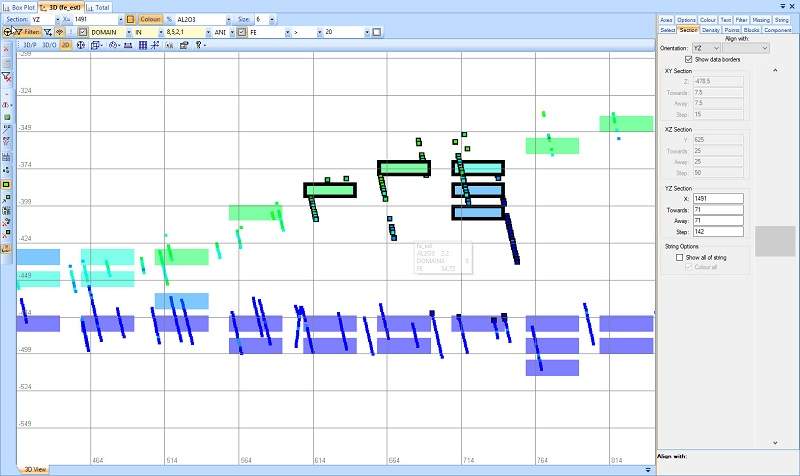
Specialised 3D integrated drill hole data analysis module
X10-Geo’s Drill Hole Data analysis module contains industry-leading tools such as:
- Contact / boundary analysis
- Twin-hole analysis
- Model validation
- Top cut analysis
- Drill hole log
Flexible and easy-to-use, these drill hole analysis tools are ideal for multi-element and multi-domain data, and are uniquely integrated with X10-Geo’s 3D visualiser for a dynamic spatial perspective.
About Phinar Software
Phinar Software is a West Australia-based software company that has been involved in geospatial data analytics and statistics software for 12 years, with an experienced team in the mining and geology software business
X10-Geo is Phinar Software’s flagship product that has been developed specifically for the global geology and mining market. It is used by geoscientists in both junior and major mining companies and consultancies worldwide, in a wide variety of mining and exploration fields.
Phinar encourages feedback and welcomes innovative ideas from its users. The close relationship between users and the X10-Geo team ensures that X10-Geo keeps moving in the right direction, and contains the most useful tools for its userbase.