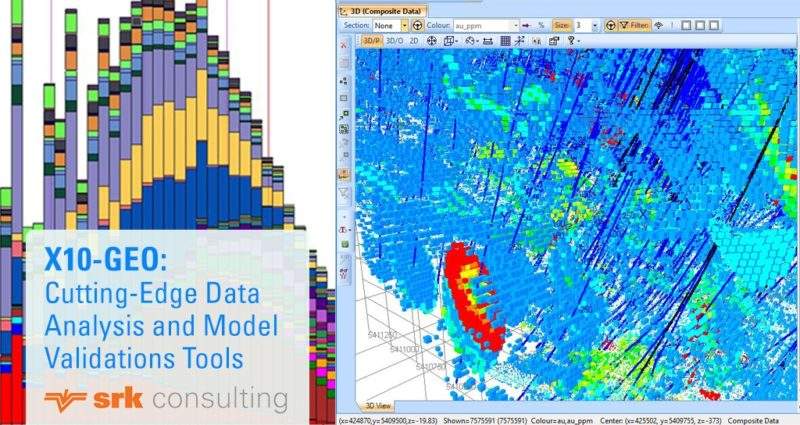
New Interactive Domain Analysis with Phinar Software’s X10-Geo
Create new domains from existing ones in X10-Geo by simply combining domain fields in tables or interactively merging domains from box plots or histograms. This saves you valuable time by removing the tedious process of editing or updating your domains in the raw data. You can then continue to refine your new domains as you work because they are updated instantly in our cutting-edge graph templates and check them in the 3D viewer at the same time to ensure they make sense spatially.
These are the new features we want to share with you:
- Create new domains from existing ones
- Merge domains from graphs like Box and Whisker plots
- Merge domains from the Domain Analysis graph or histograms
- Combine data from two or more different components
- Re-block an existing block model
You can use these features in a number of helpful ways like combining and reducing the number of domains you have to work with or building up and breaking down domains to explore or simplify your data. Now thanks to the new features in X10-Geo you can do much more than before while clearly simplifying and streamlining the processing of everyday data analysis tasks during EDA or resource estimation.
Let’s look at these new features in a bit more detail:
Create new domains
Firstly, we’ve added the new Combine Domains field page to the display window. Here, you’ll find a simple table where you select the domains you want to combine from an existing data set in the Data Tree. By selecting the domains from a list, then naming your new domain field and using the new Combine Domains button, you can merge your existing domains to create new ones. It’s as easy as that.
Merge and create domains
We have created some really successful template graphs, like the Box and Whisker plot, in X10-Geo that you can easily use to group and sort data. We thought it would be a really good idea if you could use these graphs in combination with our new Merge Domains property page to merge and create new domains interactively. You can now, for instance, build on the newly combined domains you have just created with a Box and Whisker plot from the Project Window using:
- On–graph sliders to easily group the statistically similar domains
- The 3D visualiser to sanity check the new domains on the go
- The new Merge Menu option to simply merge and name the domains you grouped with the sliders and then store them in a new domain field
- Automatically colour code all the new domains in the graph for visual analysis and to double check spatially with the 3D viewer
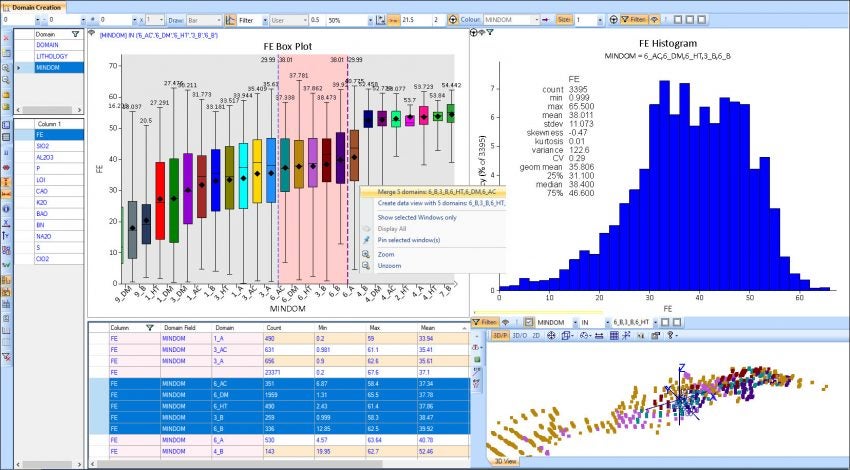
The integrated graph above shows how you use on–graph sliders with a Box plot to group domains and then merge them using the new features. You can also add another graph like a histogram which updates dynamically as the domains are selected, while the 3D viewer automatically shows the updated domains spatially at the same time. Once the new domains have been created and colour coded you can further investigate their controlling mechanisms.
The new Combine Data Function
You can now combine two or more data sets from different components in the Data Tree such as drill hole or assay files, and create a new component with your combined data. There’s an easy-to-use Combine Data function in a dropdown menu accessed from the Project Tree. You can then ‘lock’ the combined data to make a static copy (like a ‘snapshot’) or have it update to any changes to the underlying data sets. Once you have created a Combined Data component you can use graphs and other data analysis components to work with the new data.
The Re-blocking function
We have also developed a new re-blocking function in the Block Model property window that you can easily use to create blocks with larger dimensions in a new model that can then be exported as a CSV file. This can help you reduce the over-smoothing effects of smaller blocks in the resource model or you can export the resulting CSV file to use in pit optimisation runs.