
Petrolab is pleased to announce some significant changes to its Automated Mineralogy (AM) service.
Since the introduction of our AM service in 2015, we have built our reputation as a leading AM provider for the analysis of mine site and metallurgical test samples. Because we recognise that turnaround time (TAT) is increasingly important to our clients, Petrolab has invested in additional staff and equipment (a 2nd X-ray detector!) to enable more rapid preparation and analysis of samples. We have also developed an inter-active spreadsheet reporting tool – Automated Mineralogy Chart (AMC) – which will be our default format for reporting all analysis metrics.
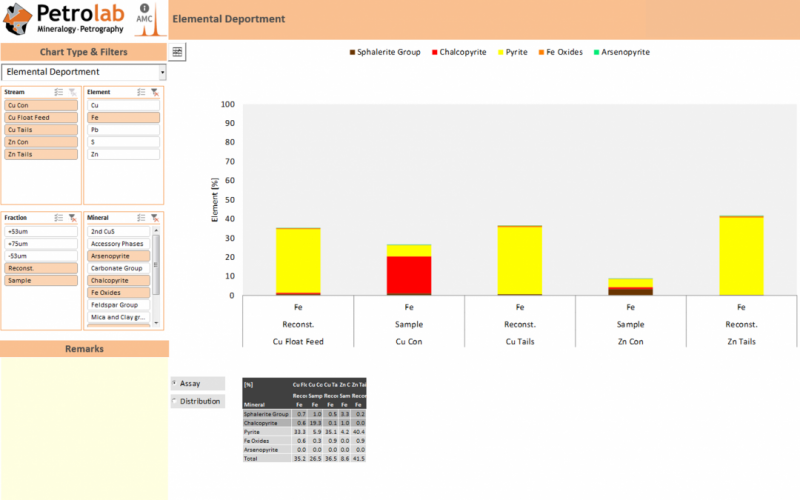
This spreadsheet tool operates as an interactive dashboard with a drop-down menu from which to choose the chart options. There are nine possible options to select from (see Figure below), including graphing options such as bulk mineral abundance, elemental deportment or theoretical grade vs. recovery. As well as displaying the graph of choice it is possible to toggle off which samples are to be viewed side-by-side, down to and including the individual submitted size fractions.
For a typical job, reporting with the AMC tool offers an improved standard target TAT of 15 working days (rather than the current 20). The AMC tool also simplifies our reporting options and price structure. Prices are set on a per analysis basis (total number of sized fractions or un-sized samples). There are two main alternatives
- AMC report – Bulk Mineral Analysis (BMA) metrics: Mineral / phase abundance & elemental deportment (now up to 4 selected elements).
- AMC report – Particle Liberation Study (PLS) metrics: As per BMA report plus all the following as standard (now up to 4 target minerals): size distribution, mode of liberation, grade vs recovery, mineral recovery by particle size, particle association, particle lock type and recovery by theoretical gravity profile.
In all cases, the AMC report includes specific notes on the mineral classification scheme and remarks on the chart types presented. Individual charts can be saved as image files and data tables can be copied to Excel (see example below showing the bulk modal output for 5 samples). A summary written interpretative report remains available as an optional extra cost item (though this would increase the TAT), along with various other options.
Clients who have tried the new AMC reports have been very positive, with one such comment: “The format of the spreadsheet report is very impressive, a great change compared to the old days.”